

On April 15, 2024, the price of bitcoin shows a mixed picture of consolidation and faint signs of recovery, indicating a pivotal point for possible bullish or negative developments.
Bitcoin
The 1-hour chart shows that the market is undecided right now, but the 4-hour and daily charts point to underlying moves that might affect how prices move in the future. The 1-hour chart shows a period of consolidation during which the price of bitcoin fluctuates between $62,773 and $66,797, putting traders in a limbo. Though the appearance of a recent large rise suggests that there may be bullish momentum, the mixed patterns that followed indicate that the market is feeling cautious.
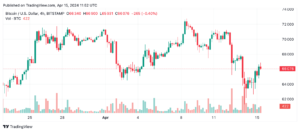
The 4-hour chart for bitcoin shows increased volatility with noticeable price swings, which is crucial for figuring out the general direction of the market. Despite the fact that there was a bounce, the fact that it was unable to top earlier highs at $71,287 indicates a lack of strong bullish conviction. Sustained breaches above this level should prompt traders to consider entering, while a decline below $61,308 may indicate a change in momentum toward the bears, indicating the need to exit to limit losses.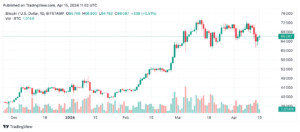
Looking at the daily chart, we can see that the market is putting bitcoin to the test given its recent recovery from a sharp decline to the $60,000 region. Recent candles’ extended wicks highlight the market’s continued volatility and traders’ hesitancy. If prices rise above the previous highs, it may be time for a calculated entrance as a sign of a recovery. On the other hand, a breach below $60,760 would signal an exit in favor of bearish domination.
A thorough examination of the moving averages (MAs) for bitcoin indicates a divided sentiment; longer-term averages (EMA and SMA 100, 200) point to buying signals, while shorter-term averages (EMA 10, 20, 30) and simple (SMA 10, 20, 30) point to selling pressure. When there are short-term sell-offs, this divergence suggests paying heed to longer-term positive signs.
At the moment, oscillators with limited directional bias, such as the relative strength index (RSI) and stochastic, are neutral. The momentum indicator’s bullish signal contrasted with the moving average convergence divergence’s (MACD) negative signal, however, creates an unsettling situation that advises traders to hold off on making big moves until stronger indications are received.
Bitcoin’s significant capital movement, with a $1.30 trillion market capitalization and a $45.24 billion 24-hour trade volume, suggests tremendous market interest. Nonetheless, the market appears to be in a state of flux, maybe preparing for its next significant move, given the generally neutral posture of most oscillators and the conflicting indications from moving averages.
Bull Verdict:
There is reasonable confidence for a possible bullish revival given the current consolidation, minor indications of an upward break in the shorter time frames, and long-term positive signals from moving averages. If bitcoin manages to break over the crucial resistance levels shown on the 4-hour and daily charts, it may indicate the start of a strong upward trend.
Bear Verdict:
On the other hand, a number of short-term moving averages exhibit a high frequency of sell signals, and important oscillators’ neutral-to-negative signals indicate that downward pressure is still present. Bitcoin would probably confirm a bearish trend if it were to break through the lower thresholds mentioned and fail to hold its current support levels.
What are your thoughts on Monday’s bitcoin market action? Please feel free to express your ideas and opinions in the space provided for comments below.