

Dogecoin Price Prediction: A clear break out of the long-term symmetrical triangle pattern suggests that the price of DOGE may be about to undergo a significant trend shift.
Dogecoin Price Prediction: Huge inflows from the spot ETF drove up the value of the underlying commodity, bitcoin, and the cryptocurrency market saw an aggressive bullish trend in late February. The altcoins continued to rise in sync with the surge in the price of Bitcoin. One such coin was Dogecoin, which increased 48.5% from $0.082 to $0.1. This swing offers a significant break out from the long-term triangular pattern, signaling a significant change in the dynamics of the market.
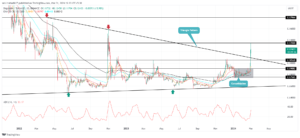
The price of Dogecoin has been moving in a horizontal trend for the previous 22 months, according to an examination of the daily time frame chart. This lateral movement, which is contained between two convergent trendlines, suggests that a symmetrical triangle pattern is developing.
Theoretically, this pattern emerged on the chart to represent the significant phase of consolidation that led to the identification of the dominating player in the market. The DOGE price provided a clear breakout from the upper boundary signal during the current spike in the cryptocurrency market, indicating that buyers are taking back control of this asset.
A notable increase in Dogecoin (DOGE) Futures Open Interest has been observed by Coinglass, a well-known cryptocurrency derivatives tracking platform. The numbers increased by 79% in just one week, from $533 million to an astounding $956 million. This increase shows that the market is more committed to Dogecoin and that investor trust is rising.
The DOGE price, which is currently trading as $0.123, saw a road at the $0.135 horizontal level. The recently discovered supply pressure can cause a small decline to $0.111 and a retest of the broken trendline.
The possible pullback might help buyers refuel their weary bullish enthusiasm and get ready for the next move up. The buyer will be more motivated to pursue the pattern’s possible target of $0.179 if they can sustain themselves above this support.
The Technical Indicator Exponential Moving Average indicates a quick buying demand in DOGE when there is an instantaneous upswing in the daily EMAs (20, 50, 100, and 200).
Directional Index Average: A high ADX 33% value suggests that buyers may soon reach fatigue and that a small retreat may be necessary to stabilize.