

On April 15, 2024, ethereum trades in a broad range between $2,991 and $3,266. Important technical indicators and chart patterns point to a possible but subtle change in market sentiment. Although there has been a bearish trend for the last week, oscillator and moving average signals suggest that there may be a bullish turnaround coming.
Ethereum
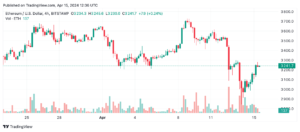
The relative strength indicator (RSI), which is currently at 44.8, shows that traders’ attitude is neutral and that ether is not overbought or oversold. This neutrality is further supported by other oscillators, including as the commodities channel index (CCI) and stochastic, which imply that short-term directional movements may be restricted. The Momentum oscillator, however, is teetering on the verge of a purchasing action, suggesting the emergence of bullish undertones.
A close examination of the moving averages reveals conflicting opinions. Prices that are trending below short-term moving averages (10, 20, 30, and 50 days) indicate a bearish trend, which is indicative of recent bearish momentum. On the other hand, the 100- and 200-day exponential moving averages support the long-term view, which points to a buy and signals a possible long-term recovery or stabilization.
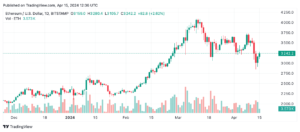
The study of the daily chart indicates that there has been a recent slump, which may be the start of a bullish reversal. Supporting this finding is a significant green candle that indicates a change in market attitude. If more bullish patterns appear and line up with bigger volumes during upward price movements, traders may want to think twice before entering the market.
A more positive picture is shown on the 4-hour chart, which shows a distinct shift from a bearish to a bullish trend with higher highs and lowers. This chart indicates that a period of consolidation may be coming to an end, providing bullish investors with a tactical entry point at the $3,000 support level.
The optimistic feeling is confirmed by a short-term study using the 1-hour chart, which shows progressively rising lows. During both up and down movements, this tendency is accompanied by higher volume, which suggests increased market activity and potential hesitancy that may precede a bigger directional move.
Bull Verdict:
The technical picture of ethereum points to a possible reversal from the recent losses, especially the positive divergence on long-term moving averages and the formation of bullish patterns in shorter time frames. Traders may view this as a good time to enter the market if it maintains the upward trend indicated by the 4-hour and 1-hour charts. They may be expecting additional gains when support levels hold and resistance points are put to the test.
Bear Verdict:
The bulk of moving averages’ bearish signals indicate that, despite sporadic indications of bullish intent, the current ethereum market conditions are still linked to a bearish backdrop. Neutral oscillator readings and high volatility indicate uncertainty, which emphasizes the possibility of additional losses, particularly if Ethereum is unable to hold above crucial support levels.
How do you feel about Monday’s ether market action? Please feel free to express your ideas and opinions in the space provided for comments below.